As you’re growing a game, getting access to as much data as possible lets you move faster and make better decisions. That’s what the Supersonic platform is all about. The tools on our platform give you greater transparency into each part of publishing so you can build stronger games.
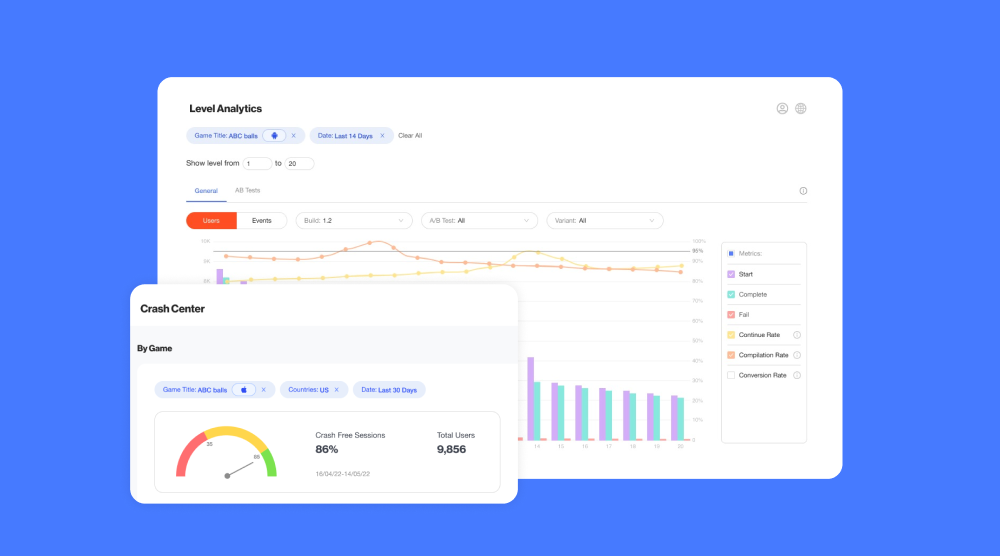
In this article we’re shifting the focus to in-game performance using Level Analytics and the Supersonic Crash Center. Use these tools together to get a full view of how players are moving through your game and how you can optimize in-game metrics like retention and playtime more efficiently.
Meital Uziel, Product Manager at Supersonic who helped build Level Analytics and Crash Center - and the other features on the platform - discusses these tools and how you can use them to give your entire in-game performance a boost.
Spot trends more quickly and easily
Seeing game performance and stability in one place lets you easily identify trends and spot areas for optimization. Level Analytics and Crash Center do exactly this by putting the most important in-game metrics at your fingertips in a highly visualized way. And since speed is essential during hyper-casual publishing, getting the full picture of game performance in front of you from the start ensures you don’t miss a beat.
Look at the most relevant metrics
In the past, you’d look at dozens of KPIs to try and pull out insights about your game’s performance. It was difficult to know if you were looking at the right set of metrics or missing out on a crucial one. But Level Analytics and Crash Center address this challenge with a set of simplified KPIs that capture the most important information about in-game performance.
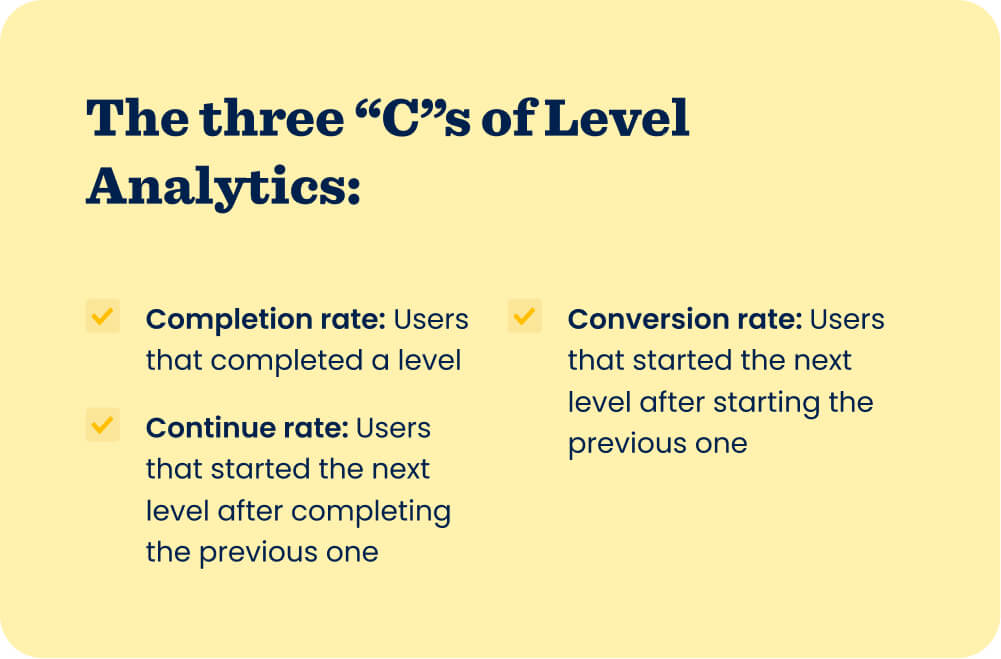
The 3 C’s of Level Analytics
For Level Analytics, we call these metrics the 3 C’s. They stand for:
- Completion rate: Users that completed a level
- Continue rate: Similar to dropoff rate, this refers to users that started the next level after completing the previous one
- Conversion rate: Users that started the next level after starting the previous one - this can happen if players skip a level after starting it
Using these three KPIs simplifies your analysis and makes it easier to spot trends. For example, looking at continue rate, you could see that it dips below the benchmark after level 4. This indicates that after users completed level 4, they didn’t continue playing to level 5.
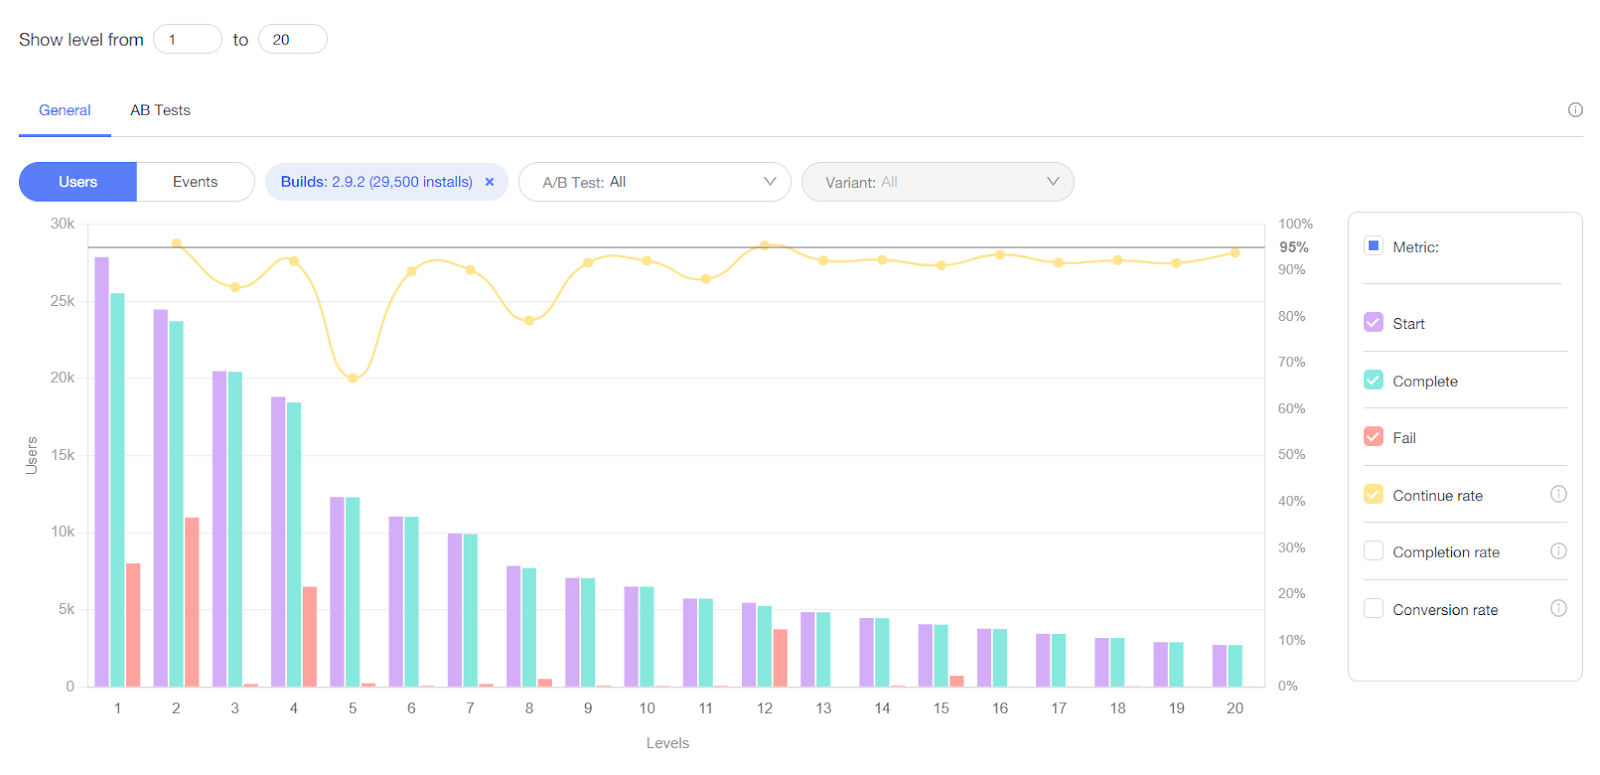
Now that you’re aware of this player dropoff, you can look at possible causes, like level difficulty and level length that could cause this drop in continue rate. In this example, you can see that the fail rate in level 4 was high, which likely means that the level is too challenging. Once you diagnose the problem, then it’s possible to solve it.
Having all of the data in front of you makes the process of spotting trends, finding the cause, and resolving the issue more efficient.
Having all of the data in front of you on Level Analytics makes this process of spotting trends, finding the cause, and resolving the issue more efficient.
Crash free sessions
In Crash Center, the approach is similar, but with just one KPI: Crash free sessions. The entire tool is set up to help you understand the parts of your game that were free from technical issues - and spot the areas where there were problems. All with a single metric.
Looking first on the high-level, you can see the crash free sessions bar and crash free rate right at the top. So you know overall game health just from these indicators. If you see that the bar is hitting the yellow or red, or the rate is low, it means there’s a technical issue.
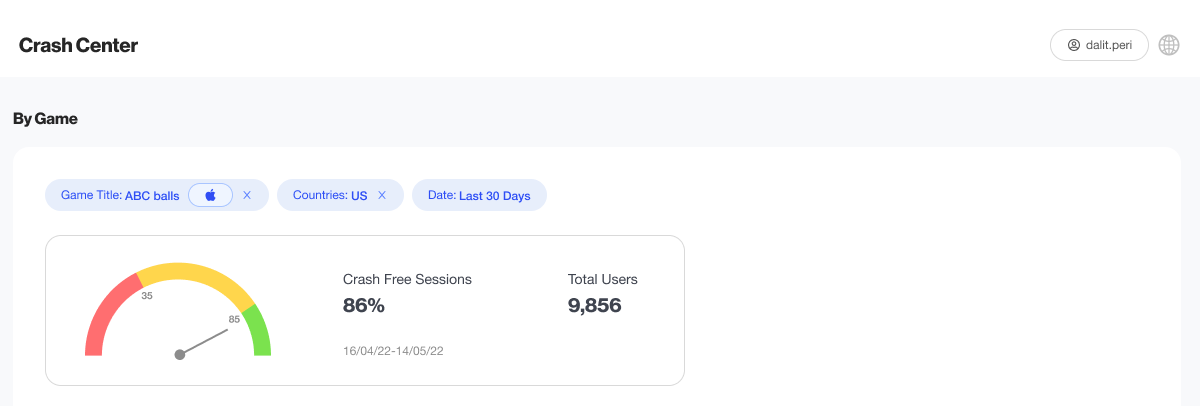
So it’s time to dive deeper and identify the issue further. In the Crash Center, you can get a breakdown of crash free sessions by date, build, device version, geo, and OS version. This lets you identify and solve tech issues with even more accuracy and speed.
Reduce player dropoff by correctly identifying issues
Level Analytics and Crash Center are both useful for identifying areas where users are dropping off. Not only can you see where the dropoff is occurring, but you can also diagnose the issue as either a content or technical problem. So you know with confidence how to solve the issue and improve in-game metrics.
Level Analytics and Crash Center let you diagnose an issue as either a content or technical problem so you know with confidence how to solve the issue and improve in-game metrics.
In Level Analytics, for example, you could see there’s a level in a recent build that has a low completion rate. Heading to Crash Center and filtering by build, you can confirm if that build had a low rate of crash free sessions. If so, the problem might be a technical issue - then you can continue drilling down in the Crash Center to identify exactly when and where it happened.
But if that build has a high rate of crash free sessions and game health appears good overall, then it’s likely a content issue. Using Level Analytics, you can compare across builds and dive into in-game performance to spot trends that could cause users to drop off before completing the level. Then it’s time to run tests like changing the level difficulty and length, and implement the winners to improve the completion rate.
One place for in-game optimizations
The Supersonic platform has these tools - and many more - as a one-stop-shop for building stronger games. With Crash Center and Level Analytics, you don’t need to head to any external platforms as you monitor game health, extract insights, and optimize in-game performance. Handling all of these tasks from one place improves efficiency and gives you more data to make high-impact decisions.
You don’t need to head to any external platforms as you monitor game health, extract insights, and optimize in-game performance.
Ready to try these tools for yourself? Head to the platform or sign up here if you’re not already a developer partner.
Let's put these tips to good use
Publish your game with Supersonic