Let’s say your game is a salad bowl. Bear with us - the salad inside represents your game’s LTV, and to maximize this, you need top-quality ingredients. In this case, that means great in-game metrics and a solid monetization strategy. Now imagine getting a complete understanding of how nutritious your salad currently is and how to make it even healthier. Meet LiveGames.
LiveGames lives on the Supersonic platform and gives developers a transparent and comprehensive view into how their post-launch game is performing - all the way from which network is scaling best to how users are behaving. The platform contains multiple dashboards within it to break down game performance from all sides, including:
- Analytics
- Top creatives
- Finances
- A/B testing
To put it back to our salad analogy, it lets you see every component that goes into the salad so you can see a clear path forward for making it even more nourishing. We’re talking in-game metrics, APPU, full screen frequency (FSF), show rate, and - of course - ARPU.
Here, LiveGames experts Maayan Eshkol, Product Monetization Team Leader at Supersonic, and Meital Uziel, Product Manager, break down the platform and share their best practices for getting the most out of it to maximize profit.
Look at your KPIs starting from the bottom
The analytics dashboard within LiveGames is one of the most valuable tools in the platform - it was built to help you understand and improve profitability. Here, you can see all the components that make up LTV so you can understand how well you’re maximizing profit and where there’s opportunity to improve. We think of this as a pyramid, with APPU at the base, your ad strategy in the middle, and ARPU at the peak.
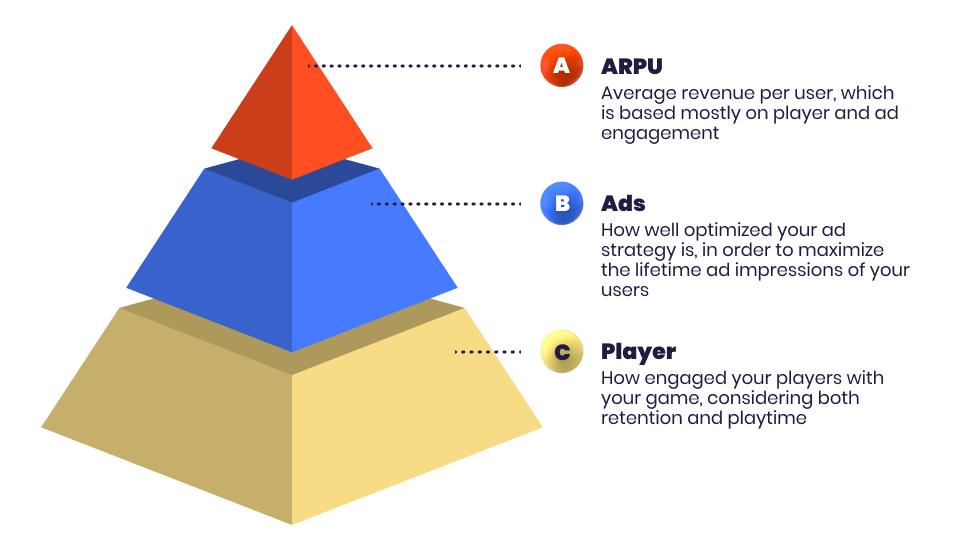
The base: Player metrics
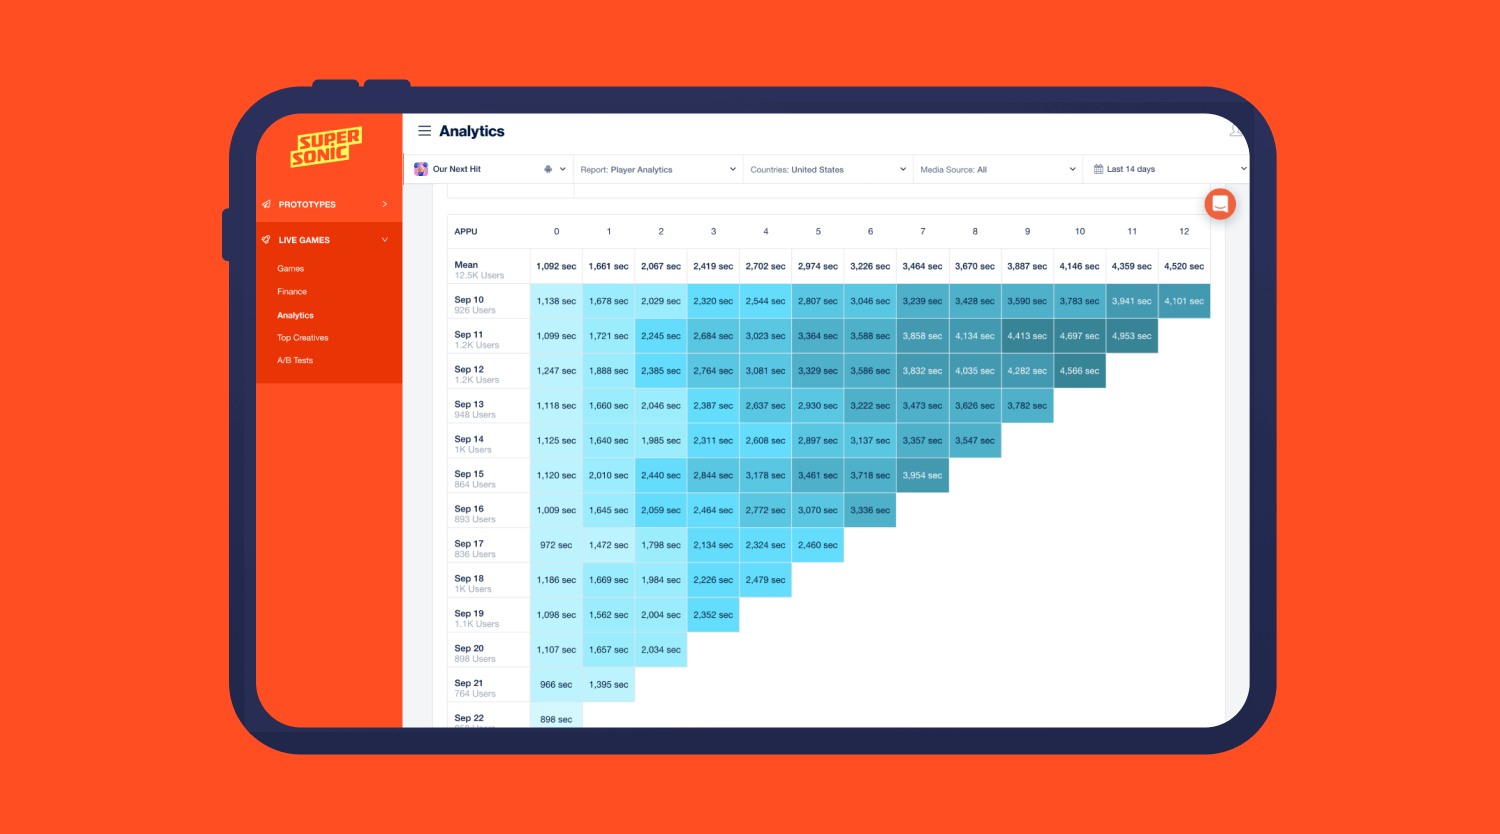
Start by looking at user metrics at the base of the pyramid by entering the “Analytics” section of LiveGames and filtering by “Report: Player Analytics”. The more time users spend in your game (playtime) and keep returning to it (retention), the more opportunities to show ads and increase profit. Often, you’d look at retention and playtime separately - but when you’re running A/B tests or making changes to your game, you could be missing out on a negative impact to retention at the expense of a positive change in playtime, or vice versa. Keeping them separate prevents you from seeing the bigger picture, or how much a change affects your user’s behavior overall.
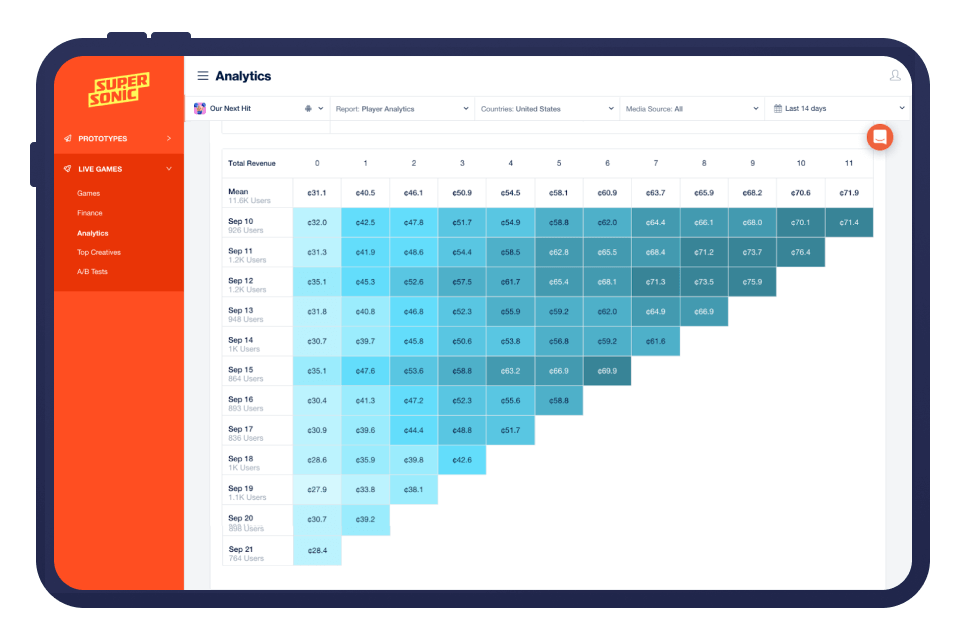
That’s why there’s another metric in LiveGames that you should look at: APPU. It’s a metric we created, and it stands for average playtime per user. Basically, it’s a cumulative measure of playtime - but only for retained users. For example, the APPU of a user that plays until D7 is the total number of seconds they played until D7. Since retention is a metric included in both APPU and LTV, APPU is an early indicator of your game’s LTV.
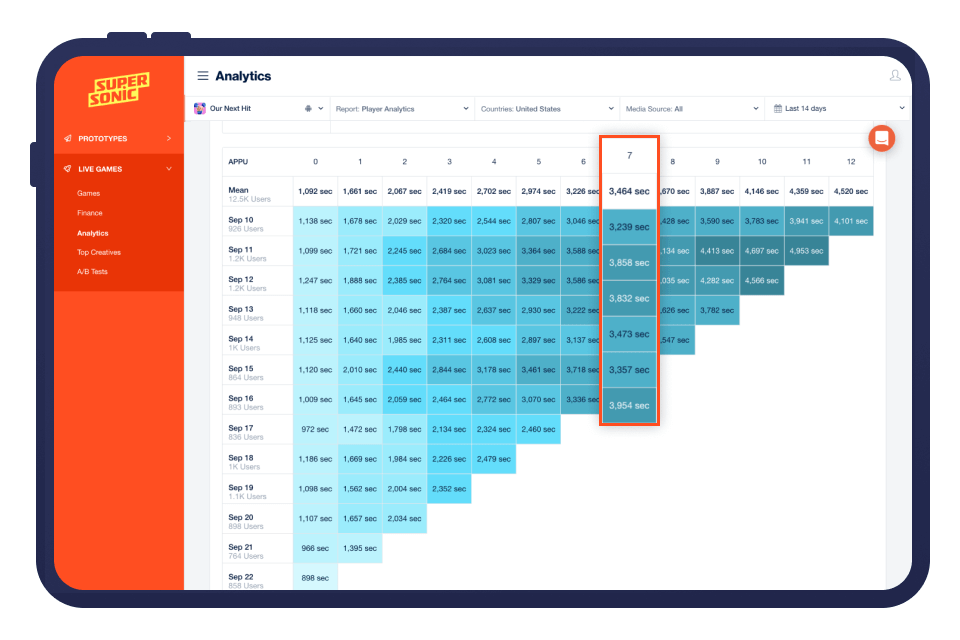
When analyzing APPU in LiveGames, focus on D7 to get a cohorted view of data that indicates how well your users are retaining and engaging. Waiting until day 7 to look at the metrics gives enough time to collect an accurate set of data that represents a user behavior trend. Analyze this cohorted data by comparing the date column to the APPU measurement (particularly at D7) so you can see how groups of users on a given day are behaving in your game - and how different changes to your game on different days can impact their engagement.
At Supersonic, we use this metric often to help predict the monetization impact of a new feature or element in a game. Looking at APPU while publishing Color Match, for example, proved that the new, 3D UI would have a positive impact on KPIs. The test indicated an APPU increase of 75% - since this is an accurate indicator of LTV, it showed that the change would improve both player metrics and profit so we ended up implementing the 3D feature across users. Without just looking at retention or playtime separately, by looking at APPU we were able to combine those metrics and see the overall likely positive impact on profitability.
The middle layer: ads
The next level of the pyramid takes you to ads - looking at the ads analytics dashboard in LiveGames can show you how well you’re turning APPU into ad impressions to maximize profitability.
That’s where full screen frequency, or FSF, comes in. This metric - another one we created at Supersonic - indicates how often you’re showing ads (rewarded video and interstitials) in your game each day. It’s calculated by taking the playtime and dividing by the number of ad impressions a user sees. For example, if a player has 1000s of playtime and they see 10 ads in one day, the FSF is 100s - this means the user is seeing an ad every 100 seconds. Our benchmark is usually an FSF of 100-120s, so this is right on target.
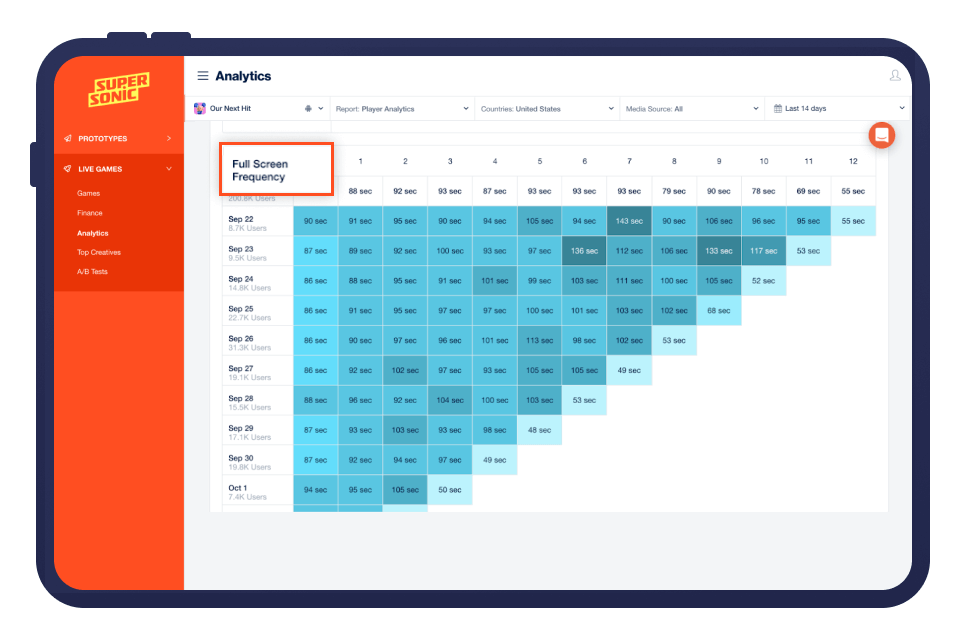
Beyond the FSF integer itself, we also look for consistency - an FSF that’s relatively stable and hitting this benchmark from D0-D7 indicates you’re monetizing users effectively and consistently. The goal is to hit the sweet spot of FSF where you’re showing users enough ads to monetize them effectively without decreasing retention. As you A/B test showing more ads to lower the FSF, check that it’s continuing to have little impact on retention and improving ARPU.
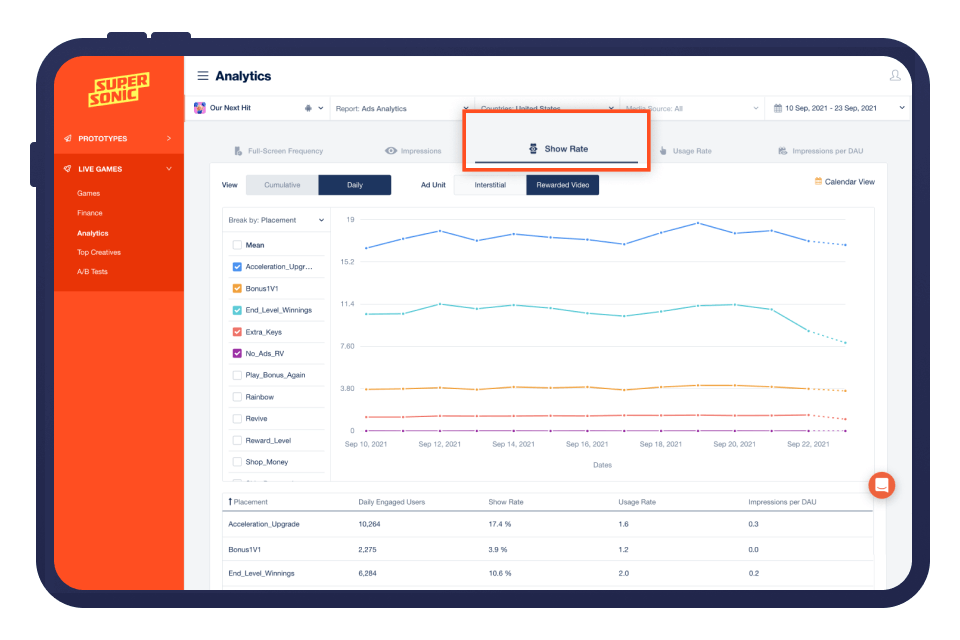
In addition to FSF, show rate is a metric that matters here, which shows the effectiveness of your rewarded video strategy. Show rate measures how many daily active users are engaging with at least one rewarded video each day, broken down by placement. This way, you can see which rewarded video placement is performing best and adjust your strategy accordingly.
Rewarded videos are often the most effective ad unit for monetization because they’re user-initiated - they don’t disrupt the player experience and can lead to a boost in retention and even conversions if implemented strategically through testing and optimizing. The more users that engage with the rewarded video, the better you understand what they like - with more data, it’s even easier to optimize your rewarded video strategy and maximize monetization opportunities.
The top: ARPU
This is where all the pieces of the puzzle come together - player metrics and your ads strategy - to see your average revenue per user, or ARPU, which indicates your profitability. In the LiveGames dashboard, you can see total ARPU which includes revenue from both in-app purchases and ads. As you make adjustments to each part of the pyramid and run A/B tests, check back here to confirm that the change made a positive impact on revenue - and in turn, profit. It’s presented in a cohorted view that shows you the aggregate ARPU by date so you can easily check the results according to when the test was run.
As Black Candy grew their game Escalators with Supersonic, they frequently used the LiveGames dashboard to check their KPIs after performing A/B tests. Doing so let them track the increase in ARPU and get transparency into their game’s revenue.
Fill the bowl to maximize profit
If the goal is to fill the salad bowl that is ARPU, then LiveGames gives you exactly the tools to do that. It lets you track each component - or ingredient - that goes into the bowl so you can understand what’s missing. With this transparency, it’s easier to spot and then optimize that missing piece to maximize profitability.
Let us know how you use the LiveGames platform - reach out to us on LinkedIn and leave a comment.
Let's put these tips to good use
Publish your game with Supersonic