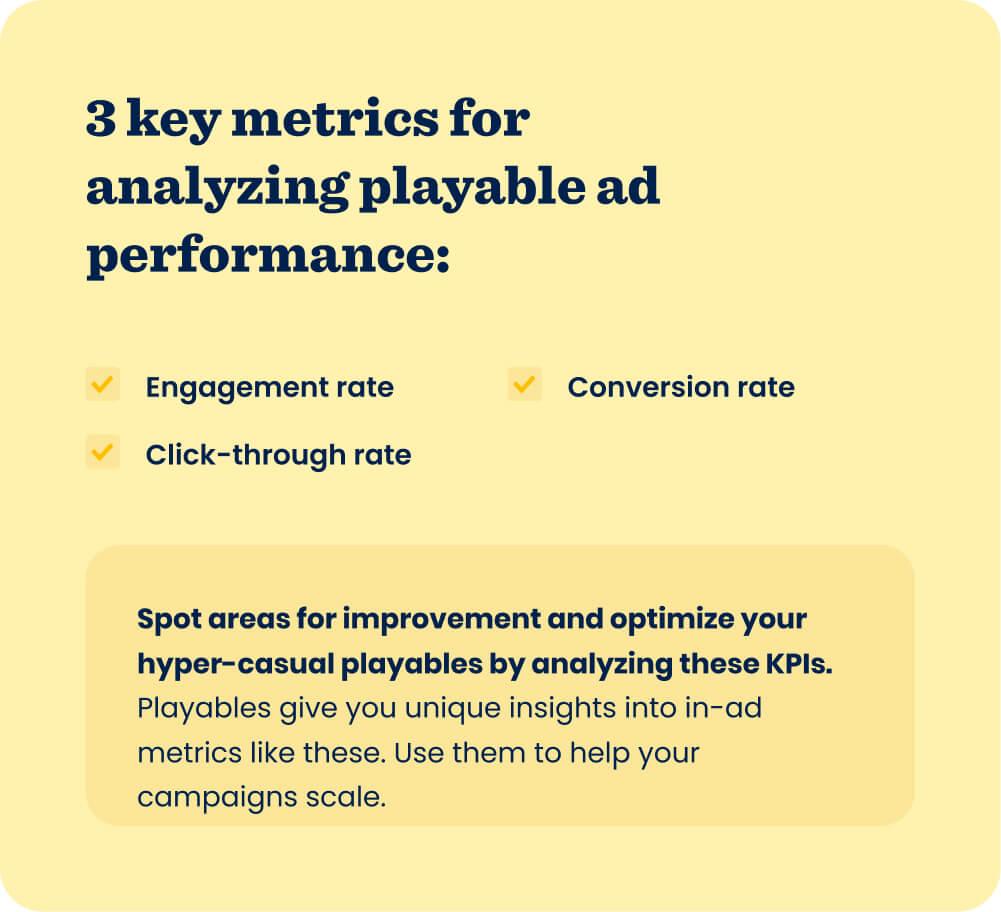
Designing and testing playables is the first part of solving the creative puzzle to drive scale, which you can find more about in this blog post. But you also need to understand how to measure the effectiveness of your design and the impact of testing new variations. Asaf Prager, Creative Manager at Supersonic, shares how he and his team use three essential metrics - engagement rate (ER), conversion rate (CVR), and click-through rate (CTR) - to analyze and optimize playable ads.
1. Engagement rate
Engagement rate (ER) tells you how many users engaged with the playable ad and confirms if the first few seconds succeeded at capturing their attention. ER is a particularly helpful metric for analyzing the effectiveness of your playable tutorial - if it’s low, it usually means users didn’t understand how to start playing. To increase ER, test different versions of the tutorial that could clarify gameplay or entice users to start playing. Perhaps that means adding a pointer, changing the text on-screen, or altering the environment so there are less distractions on-screen.
The time to engage (4 seconds) and engagement rate (72.6%) of an early version of a Stacky Dash playable ad showed there was room to optimize both metrics. Changing the tiles and environment, along with increasing the color contrast, made the board more clear and resonated with users more effectively - ER increased to 82% and time to engage decreased to 3 seconds.
2. Click-through rate
Your playable’s click-through rate (CTR) indicates the number of users who visited the app store from your playable ad. This KPI indicates the effectiveness of your playable’s gameplay and confirms that users understood how to play the game and want to keep playing - they usually wouldn’t play through to the end if they didn’t.
Analyze the winning CTR rate vs. losing CTR rate (how many users won vs. failed your playable then clicked through to the store) to get insights for optimizing your playable. For example, if the losing CTR rate is low - meaning people who failed your gameplay didn’t click through to the store - then try making your playable less challenging and see if CTR rate increases when the winning CTR rate is higher.

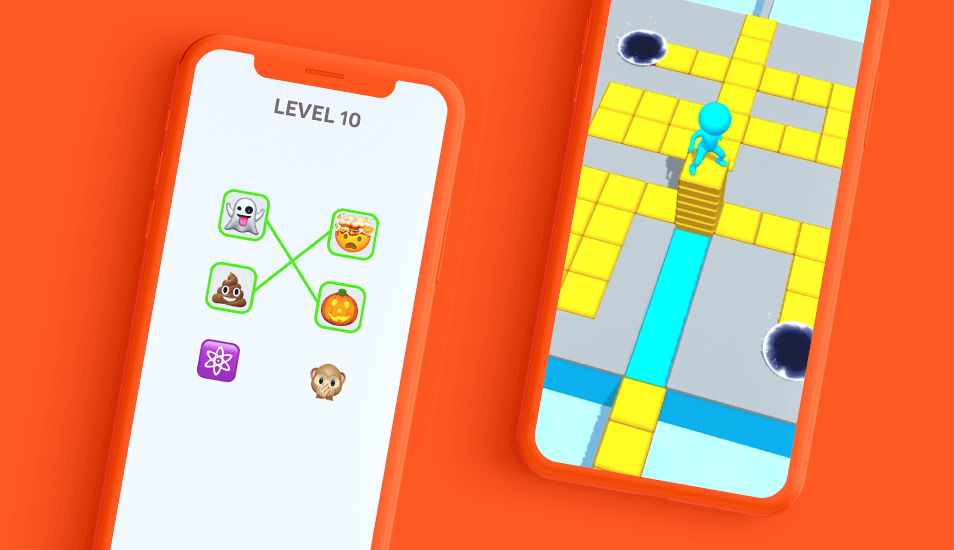
An early version of an Emoji Puzzle playable ad had a CTR of 75% and had users play through a full level before going to the store. Recognizing room to improve CTR and seeing the success of a video creative that used different emojis and instructions, the new version swapped out the emojis and text and reduced duration of play. These changes to gameplay and visuals boosted CTR to 86%, helping Emoji Puzzle reach #2 on Android.
3. Conversion rate
Conversion rate (CVR) indicates that the experience your playable gives users connects to the experience they get in the store. It relates to the performance of both the ad’s gameplay and the end card. If your playable gameplay or CTA is misleading, when users go to the app store and see a totally different type of game than what they played in your ad, they won’t install it. As a result, CTR would be high but CVR would be low.
Conversion rate indicates that the experience your playable gives users connects to the experience they get in the store.
In addition to CVR, in-game metrics like ARPU and retention are helpful for determining whether the game experience differs from the ad. If users still installed your app after getting to the store but then the gameplay wasn’t what they expected, then they may not stick around and keep playing your game - ARPU and retention will be low.
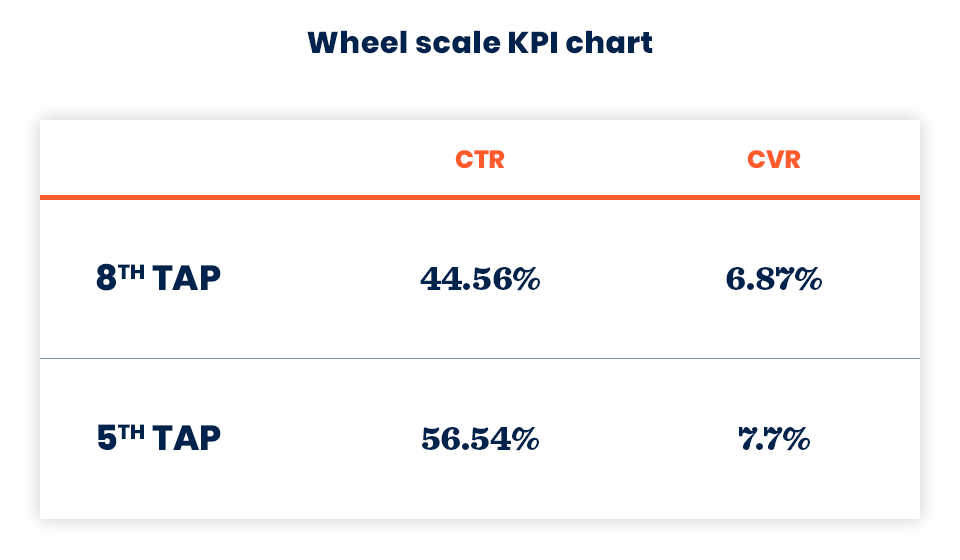
For Wheel Scale, analyzing the in-ad metrics showed that users were dropping off before they went to the app store indicated there was room to optimize CTR and CVR. By testing versions of playables with different numbers of swipes needed to complete the playable, we found that that 5 swipes was the magic number. CTR, CVR, and IPM all increased, which showed that reducing swipes from 8 to 5 was just the right amount of gameplay for users to understand the game mechanic, complete the level, and still want to play more. It’s also an indicator that the experience of going to the app store from the playable was seamless and easy, encouraging CVR to increase to 7.7%.
Completing the circle with analytics
Playable ads give you insights into user engagement and the effectiveness of your creative strategy in a way that video creatives just can’t. Complete the creative puzzle by analyzing your key metrics - you can then use these to inform design decisions and optimize playable performance further.
Let's put these tips to good use
Publish your game with Supersonic